


Best Machine Learning Practices
What makes a good machine learning model?
A good ML model hinges on the data collection and preparation stages but then again, the steps taken during ML is also very important. Give 5 people the same dataset to build a machine learning model, its probable that each model will be created using a different approach. A lot of ML modeling tutorials available online are basic, and most don't have adequate information as to do's and don'ts of creating ML models from top to bottom. One of the recent advancements in ML includes the "scikit" pipelines. They are a good way of building machine learning models in a highly reusable and test driven manner.
Also, there are many questions surrounding the ML problem and how do you identify the error metric to use to tackle a specific business problem. Accuracy is not always the "answer" for a classification model, neither is the RMSE for a regression model.
Model Creation
There are 7 major steps to building a machine learning model. Some of these steps are low-level but a very integral part of the coding process.
-
Data Collection
-
Data Preparation
- - This includes data exploration, feature engineering, feature selection e.g. using
SelectKBest().
- - This includes data exploration, feature engineering, feature selection e.g. using
-
Choose a model
- - Decide on the error metric which fits the business problem and select the algorithms to use to create the model.
-
Train the models
-
- Set seed.
-
- Train Test split and use cross-validate on all the models
-
- Standardise the feature variables using MinMax Scaler, Standard Scaler etc. Make sure to
fit_transform()the train data,transform()the test data. This was discussed clearly in this article What and why behind fit_transform() and transform() | Towards Data Science -
- if you are dealing with KNN and K-Means (both use Euclidean distance), PCA, Neural Networks, gradient descent algorithms that compute distance (Cosine or Euclidean for example) or assumes normality, scale!
-
- Decision trees do not need scaling.
- - You wouldn’t want to scale ordinal features. [1]
-
- Evaluate the models
-
-
Refit the selected model using the steps in 4 above.
-
Parameter Tune the selected model
-
Predict using the best performing parameters on unseen datasets. [2]
x# SIMPLE ML MODEL
from pandas import read_csv
from sklearn.model_selection import train_test_split
from sklearn.metrics import classification_report
from sklearn.metrics import confusion_matrix
from sklearn.metrics import accuracy_score
from sklearn.svm import SVC
# Load dataset
url = "https://raw.githubusercontent.com/jbrownlee/Datasets/master/iris.csv"
names = ['sepal-length', 'sepal-width', 'petal-length', 'petal-width', 'class']
dataset = read_csv(url, names=names)
# Split-out test dataset
array = dataset.values
X = array[:,0:4]
y = array[:,4]
# set seed and train test split
X_train, X_test, Y_train, Y_test = train_test_split(X, y, test_size=0.20, random_state=1)
# Make predictions on test dataset
model = SVC(gamma='auto')
model.fit(X_train, Y_train)
predictions = model.predict(X_test)
# Evaluate predictions
print(accuracy_score(Y_test, predictions))
print(confusion_matrix(Y_test, predictions))
print(classification_report(Y_test, predictions))
Pipelines
A pipeline is a progression of steps where information is changed. In this way, you may have a class for each filter and afterward another class to join those means into the pipeline and make a complete final pipeline.[3]
NOTE: The script below is used to explain the concept behind pipelines and not necessarily explain the ML steps previously discussed.
xxxxxxxxxx
# ML MODEL USING PIPELINES
import pandas as pd
import numpy as np
from pandas import read_csv
from pandas.api.types import is_string_dtype, is_numeric_dtype, is_categorical_dtype
from sklearn.ensemble import RandomForestRegressor, RandomForestClassifier,GradientBoostingClassifier
from sklearn import metrics
from sklearn.preprocessing import LabelEncoder, OneHotEncoder, StandardScaler
from sklearn.impute._base import SimpleImputer as Imputer
from pandas.api.types import is_string_dtype, is_numeric_dtype, is_categorical_dtype
from sklearn.model_selection import train_test_split
from sklearn.pipeline import Pipeline
from sklearn.impute import SimpleImputer
from sklearn.base import BaseEstimator, TransformerMixin
from sklearn.compose import ColumnTransformer
import sklearn.metrics as metrics
from sklearn.metrics import accuracy_score, f1_score, precision_score, recall_score
# Load dataset
titanic_df = pd.read_csv('./train.csv')
# Dropping Passenger ID as its not required feature
titanic_df = titanic_df.drop('PassengerId', axis=1)
titanic_df.head()
# view new df
titanic_df.dtypes
titanic_df
# Split the data into train and test.
X = titanic_df.drop('Survived', axis=1)
y = titanic_df['Survived']
X_train, X_test, y_train, y_test = train_test_split(X, y, test_size=0.2, random_state=1)
# define features according to feature type
numeric_features = ['Age', 'Fare']
categorical_features = ['Pclass', 'Sex', 'SibSp', 'Parch', 'Embarked']
name_feature = ['Name']
cabin_feature = ['Cabin']
# create the pipeline steps for the transform methods below
numeric_transformer = Pipeline(steps=[
('imputer', SimpleImputer(strategy='median')),
('scaler', StandardScaler())])
categorical_transformer = Pipeline(steps=[
('imputer', SimpleImputer(strategy='constant', fill_value='missing')),
('onehot', OneHotEncoder(handle_unknown='ignore'))])
cabin_categorical_transformer = Pipeline(steps=[
('imputer', SimpleImputer(strategy='constant', fill_value='U')),
('labelEncoder', LabelEncoder()),
('onehot', OneHotEncoder(handle_unknown='ignore'))])
# set up the transformers using classes
class CabinFeatureTransformer(BaseEstimator, TransformerMixin):
def __init__(self):
print('in the CabinFeatureTransformer init method: ')
def fit(self, x, y=None):
return self
def transform(self, x):
# replacing missing cabins with U (for Unknown)
x.Cabin.fillna('U', inplace=True)
# mapping each Cabin value with the cabin letter
x['Cabin'] = x['Cabin'].map(lambda c: c[0])
cabin_dummies = pd.get_dummies(x['Cabin'], prefix='Cabin')
self.cabin_columns= cabin_dummies.columns
cabin_dummies = cabin_dummies.reindex(columns = self.cabin_columns, fill_value=0)
x = pd.concat([x, cabin_dummies], axis=1)
x.drop('Cabin', axis=1, inplace=True)
return x
class NameFeatureTransformer(BaseEstimator, TransformerMixin):
def __init__(self):
print('in the NameFeatureTransformer Init method: ')
def fit(self, x, y=None):
return self
def transform(self, x):
Title_Dictionary = {
"Capt": "Officer", "Col": "Officer", "Major": "Officer","Jonkheer": "Royalty",
"Don": "Royalty","Sir" : "Royalty","Dr": "Officer","Rev": "Officer","the Countess":"Royalty",
"Mme": "Mrs", "Mlle": "Miss", "Ms": "Mrs", "Mr" : "Mr", "Mrs" : "Mrs", "Miss" : "Miss",
"Master" : "Master", "Lady" : "Royalty"}
x['Title'] = x['Name'].map(lambda name:name.split(',')[1].split('.')[0].strip())
x['Title'] = x.Title.map(Title_Dictionary)
x.drop('Name', axis=1, inplace=True)
titles_dummies = pd.get_dummies(x['Title'], prefix='Title')
x = pd.concat([x, titles_dummies], axis=1)
x.drop('Title', axis=1, inplace=True)
return x.values
transformer = ColumnTransformer(
transformers=[
('numeric_data_preprocessing', numeric_transformer, numeric_features),
('categorical_data_preprocessing', categorical_transformer, categorical_features),
('cabin_data_preprocessing', CabinFeatureTransformer(), cabin_feature),
('name_data_preprocessing', NameFeatureTransformer(), name_feature)
])
final_pipeline = Pipeline(steps=[('transformer', transformer),
('rf_estimator', RandomForestClassifier())])
# fit the model and predict on test dataset
final_pipeline.fit(X_train, y_train)
y_pred = final_pipeline.predict(X_test)
# print model evaluation metrics
print("Accuracy Score: ", accuracy_score(y_test, y_pred))
print("F1 Score: ", f1_score(y_test, y_pred, average='weighted'))
print("Precision Score: ", precision_score(y_test, y_pred, average='weighted'))
print("Recall Score: ", recall_score(y_test, y_pred, average='weighted'))
Model Evaluation
The aim of evaluating a model is to minimise the bias and variance. Underfitting occurs where you have high bias and low variance, Overfitting occurs when you have high variance and low bias. To understand more about the bias-variance tradeoff in Machine learning read Bias and Variance Tradeoff | Beginners Guide
Classification
A classification problem may have two (binary) or more (multi-class) class labels.
Class Imbalance
An imbalanced classification problem is when there is a skewed distribution in the datapoints of the known classes. In other words, this is due to a disproportionate distribution of classes in the dataset. e.g. Class 0 with 100 examples, Class 1 with 90 examples and Class 2 with 10 examples.
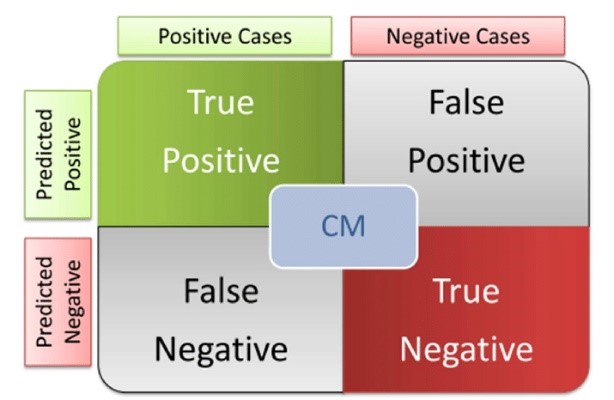
TP, FP, TN, FN
Have you ever thought this: there are so many classification scoring techniques, which should I use?
Before you decide on which to use, its important to first understand what these mean.
Accuracy
It's easy to assume that this is the best error metric for your ML model, however, this is not always the case. You shouldn’t use accuracy on imbalanced problems. Then, it is easy to get a high accuracy score by simply classifying all observations as the majority class.
Application
-
- When your problem is balanced using accuracy is usually a good start. An additional benefit is that it is really easy to explain it to non-technical stakeholders in your project,
-
- When every class is equally important to you.[4]
Precision
This indicates what proportion of positive identifications were actually correct.
Sometimes they are referred to as Precision Curves, Positive Predicted Value (PPV). Say we develop a machine learning model that determines if a stock will be a good investment or not. If we were to pour our entire net worth into this one stock, we would better hope that our model is right. Precision would be the best metric to use here because it determines the correctness of our model. We can afford to miss a few profitable stock investments here and there. More clearly, Precision defines how many of the positively classified were relevant.
Recall
This indicates what proportion of actual positives were identified correctly.
Sometimes they are referred to as True Positive Rate, Sensitivity, Recall Curves. Let’s say we were trying to detect if an apple was poison or not. In this case, we would want to reduce the number of False Negatives because we hope to not miss any poison apples in the batch. Recall would be the best evaluation metric to use here because it measures how many poison apples we might have missed. We are not too concerned with mislabelling an apple as poisonous because we would rather be safe than sorry. More clearly, Recall defines how good a test is at detecting the positives.
As mentioned earlier, Sensitivity is the same as Recall, however, Specificity, also known as True Negative Rate measures how good the test is at avoiding false alarms.
F1 Score
Useful where you can’t really rely on both Precision and Recall. You use this when choosing either of precision or recall score can result in compromise in terms of model giving high false positives and false negatives respectively. F1 score is balancing precision and recall on the positive class while accuracy looks at correctly classified observations both positive and negative
The farther F1 is from 0, the better. F1, just like Precision and Recall range from 0 to 1.
Application
-
Pretty much in every binary classification problem where you care more about the positive class. There is also a Multi-Class F1 Score.
-
It can be easily explained to business stakeholders which in many cases can be a deciding factor. Always remember, machine learning is just a tool to solve a business problem. [4]
PRC AUC
PRC is short for "Precision Recall Curve". You can use this plot to make an educated decision when it comes to the classic precision/recall dilemma. At a certain point, the higher the recall the lower the precision. Knowing at which recall your precision starts to fall fast can help you choose the threshold and deliver a better model.
Application
- - when you want to communicate precision/recall decision to other stakeholders
- - when you want to choose the threshold that fits the business problem.
- - when your data is heavily imbalanced. As mentioned before, it was discussed extensively in this article by Takaya Saito and Marc Rehmsmeier. The intuition is the following: since PR AUC focuses mainly on the positive class (PPV and TPR), it cares less about the frequent negative class.
- - when you care more about positive than negative class. If you care more about the positive class and hence PPV and TPR you should go with Precision-Recall curve and PR AUC (average precision).[4]
ROC AUC
AUC is short for "Area Under the Curve". ROC is short for "Receiver Operating Characteristic". This is a plot of signal (True Positive Rate) against noise (False Positive Rate). The higher TPR and the lower FPR is for each threshold the better and so classifiers that have curves that are more top-left-side are better. The model performance is determined by looking at the area under the ROC curve (or AUC). The best possible AUC is 1 while the worst is 0.5 (the 45 degrees random line). Any value less than 0.5 means we can simply do the exact opposite of what the model recommends getting the value back above 0.5.
Applications
- - You should not use it when your data is heavily imbalanced. It was discussed extensively in this article by Takaya Saito and Marc Rehmsmeier. The intuition is the following: false positive rate for highly imbalanced datasets is pulled down due to a large number of true negatives.
- - You should use it when you care equally about positive and negative classes. It naturally extends the imbalanced data discussion from the last section. If we care about true negatives as much as we care about true positives then it totally makes sense to use ROC AUC.
- - You should use it when you ultimately care about ranking predictions and not necessarily about outputting well-calibrated probabilities (read this article by Jason Brownlee if you want to learn about probability calibration). [4]
Regression
Regression models are not ranked using accuracy. There are a number of metrics to use, the most common are briefly described below but to learn more about regression error metrics, read these articles Understanding Linear Regression and Regression Error Metrics and Regression: An Explanation of Regression Metrics And What Can Go Wrong
MSE (Mean Squared Error)
RMSE (Root Mean Squared Error)
MAE (Mean Absolute Error)
It is good practice to establish a baseline MAE for your dataset using a baseline model. A model that achieves a better MAE than the MAE for the baseline model is preferable.
MAPE (Mean Absolute Percentage Error)
The lower the MAPE, the more accurate the model. E.g. a model with MAPE 2% is better than a model with MAPE 10% on the same data.
R-squared or Coefficient of Determination
Adjusted R-squared
Conclusion
Thank you for reading my article. There is a lot of resource for writing and testing ML code in python. "scikit-learn" is a very powerful tool with loads of resource materials and support and innovation. I reckon this will be suitable for:
-
- Writing production ready ML scripts and pipelines in our solutions domain projects.
-
- Providing the foresight suite with production-ready code.
Sources
- All about Feature Scaling. Scale data for better performance of… | by Baijayanta Roy | Towards Data Science
- [7 Steps to Machine Learning: How to Prepare for an Automated Future | by Dr Mark van Rijmenam | DataSeries | Medium]
- ML Pipelines using scikit-learn and GridSearchCV | by Nikhil pentapalli | Analytics Vidhya | Medium
- F1 Score vs ROC AUC vs Accuracy vs PR AUC: Which Evaluation Metric Should You Choose? - neptune.ai
Leave a Reply
Your email address will not be published. Required fields are marked *